
Scrape and Extract data from websites and draw charts - How to gain valuable long-term insights
Topic
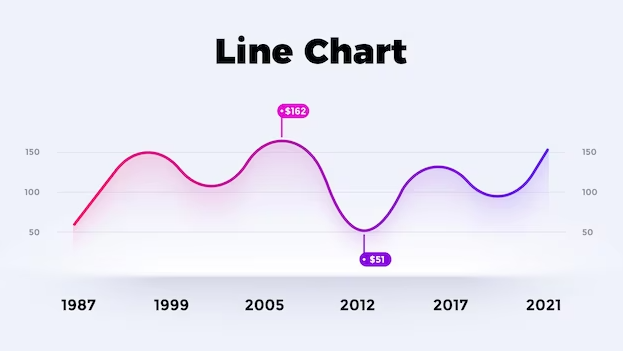
Visualising long-term insights can lead to a lot of interesting and valuable realisations.
The web is always changing, but how does that information look across a week? a month? a year?
What if you wanted to draw a graph to show the number of properties advertised over a week? a month? a year?
Using the Extract Data feature you can easily build a report (scrape data) based on specific text on a website, some examples;
- Number of real-estate results for a given search
- Number of google results for a given search
- Airbnb advertised apartments in a city
- Temperature or other climate information
- Scrape and graph prices, availability and more
Basically, any web page where it contains a number - can be used to build valuable reports.
Example - Graph the number of results returned for a real-estate search over time
Scenario: You're watching a local real-estate website, and want to visualise trends over time for the number of search results, you've already setup your watch.
Here, we can see that the text says "We found 473 properties for you", so let's Extract Data on that text, receive the number only component as CSV and then draw a graph.
( In other words, let's build a graph over time of that "473" results word )

Head on over to your watch over-view list, click on DIFF to bring up the differences inspector, then click the Extract Data tab

So here's how to tell changedetection to extract that "473" over time, from all previous change snapshots and build a nice CSV report (of which we can easily import into Google Sheets and draw pretty graphs! )
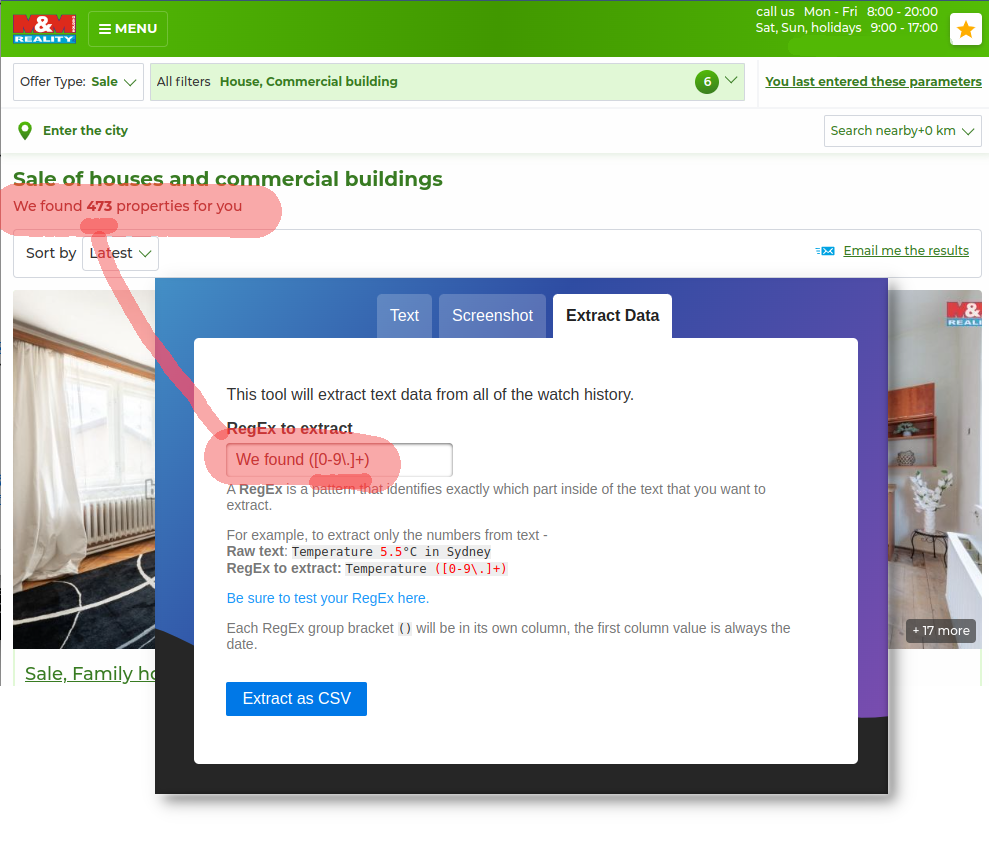
The trick here is that we ONLY want to include the "473" text, not the whole "We found 473...", otherwise the spreadsheet will not understand the value as it would contain a mix of numbers and text.
So to ONLY include the "473" text we can use a simple Regular Expression (A simple rule that tells it exactly what text to be interested in), using round brackets "()" we can tell changedetection to just use any digits that come after "We found..."
In our case, the best is to use ([0-9]+) as the rule (any number 0-9 that is repeated), because its wrapped in "()" it means it will only pull that text/digits
So go ahead and enter We found ([0-9]+)
Then click Extract as CSV, in a few moments the system will look over all previous change snapshots, extract the text, and send you a CSV with the Time/date, time (in epoch format), and the number in the brackets from the Regular Expression.
And here we have it :-) after Importing to Google Sheets, then follow the steps to how to create a chart in google sheets
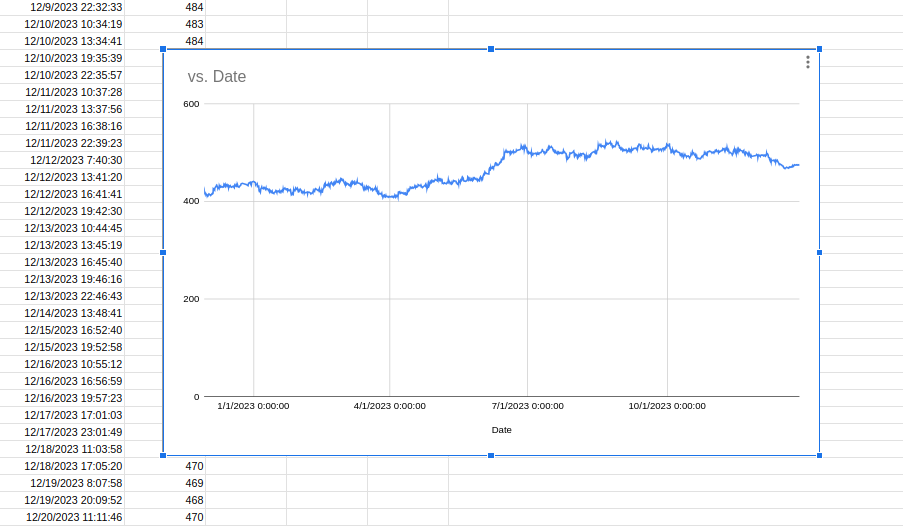
More fine examples to come (feel free to contact us and ask for a recipe!), but here is just one basic way to gather super interesting visualised line/chart data from website pages over time.